CS336 Lecture 6 - Kernels, Triton
- Lecture plan for GPU performance work on language-model components
- GPU architecture essentials: SMs, memory hierarchy, thread blocks, warps, and waves
- Benchmarking and profiling are prerequisites for targeted GPU optimization
- How to implement robust GPU benchmarking: warm-ups, trials, and synchronization
- Empirical scaling of matrix multiply and MLP workloads reveals overheads and linear relationships
- Profilers expose low-level CUDA activity behind PyTorch calls, including kernel launches and synchronization
- Composite primitives like cdist decompose into GEMMs, elementwise ops, and copies with GEMM typically dominating
- Fused implementations exist for key nonlinearities such as GELU and softmax to minimize memory traffic and launch overhead
- CPU and GPU execute asynchronously; NVTX annotations and Nsight timelines reveal queueing, synchronization points, and the effect of CPU-side operations
- Kernel fusion concept: fuse multiple elementwise ops into one kernel to reduce repeated memory movements
- A naive PyTorch elementwise GELU implementation issues many kernels and is much slower than a fused implementation
- How a custom CUDA kernel implements fused elementwise computation using the grid/block/thread model
- Triton DSL: block-centric vectorized GPU programming in Python that emits PTX
- Torch.compile JIT can automatically fuse operations and emit Triton kernels to approach or exceed hand-written kernels for many primitives
- Softmax in Triton: handle reductions by assigning rows to blocks, using vectorized loads, computing max/exponentials/sum, and writing normalized outputs
Lecture plan for GPU performance work on language-model components
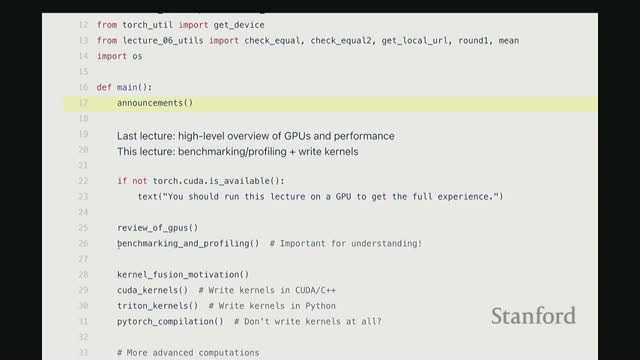
The lecture outlines a practical course segment focused on writing high-performance GPU code for language-model primitives using multiple approaches.
Key objectives for students:
-
Profile code to find real bottlenecks.
-
Implement a Triton kernel for FlashAttention.
-
Write CUDA kernels in C++ and inspect generated PTX to understand low-level GPU behavior.
-
Compare custom kernels against PyTorch’s JIT-compiled implementations.
-
Benchmark, profile, and iteratively optimize common components (e.g., softmax, GLU) in preparation for Assignment 2.
Emphasis:
- Empirical, side-by-side comparison of implementations.
- Understanding the hardware- and assembly-level implications of kernel designs.
GPU architecture essentials: SMs, memory hierarchy, thread blocks, warps, and waves

-
GPU architecture is organized into streaming multiprocessors (SMs) that contain many arithmetic units and a large register file for per-thread temporaries.
- The memory hierarchy ranges from large, high-latency global DRAM down to caches, on-SM shared memory, and registers (small, low-latency). Minimizing DRAM traffic and exploiting registers/shared memory is critical for performance.
- Parallel execution is hierarchical:
- A grid of thread blocks is scheduled onto SMs.
- Each block contains many threads.
- Threads execute in groups of 32 called warps, the hardware scheduling granularity.
- A grid of thread blocks is scheduled onto SMs.
- Performance considerations:
- Balance work across warps and blocks to improve utilization.
-
Arithmetic intensity (flops per byte moved) must be maximized to avoid memory-bound behavior.
- Well-tuned GEMM is typically compute-bound; many other kernels become memory-bound without careful fusion or tiling.
- Balance work across warps and blocks to improve utilization.
Benchmarking and profiling are prerequisites for targeted GPU optimization
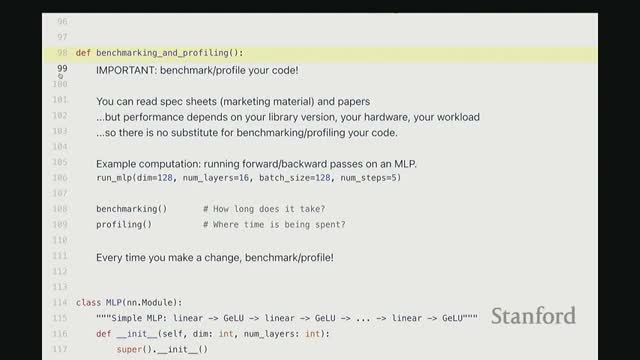
Effective GPU optimization starts with two complementary activities:
-
Coarse-grain benchmarking — measure end-to-end wall-clock time to understand steady-state throughput.
-
Fine-grain profiling — inspect kernel launches, library calls, and synchronization to locate hotspots and CPU-side overheads.
Why both matter:
- Benchmarking captures real performance under representative loads and exposes scaling behavior.
- Profiling reveals where time is spent (dominant kernels, dispatch/launch costs, synchronization), which guides whether to hand-write kernels, use Triton, or rely on a JIT.
- Without empirical measurement, optimization effort is often misdirected.
How to implement robust GPU benchmarking: warm-ups, trials, and synchronization
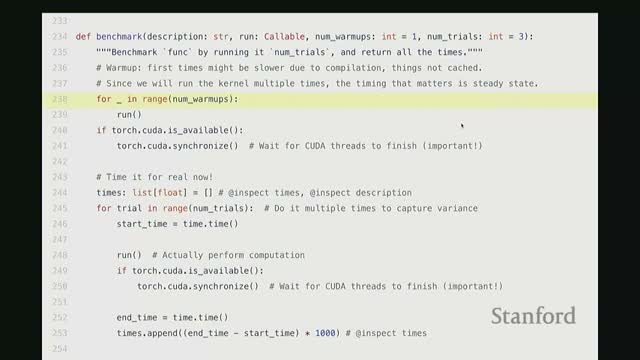
A correct GPU benchmarking wrapper should follow a reproducible pattern:
- Run several warm-up iterations so JIT compilation and device initialization finish before timing.
- Execute multiple timed trials to reduce noise from system variability and thermal effects.
- Call torch.cuda.synchronize() before and after measured regions so the CPU waits for GPU completion and timings reflect GPU work.
- Aggregate results (average, median, or distribution) to report robust runtime estimates.
Usage example (conceptual): benchmark a representative MLP with fixed dimensions, layers, batch-size, and repeated forward/backward steps to compare implementations and scaling behavior.
Empirical scaling of matrix multiply and MLP workloads reveals overheads and linear relationships
-
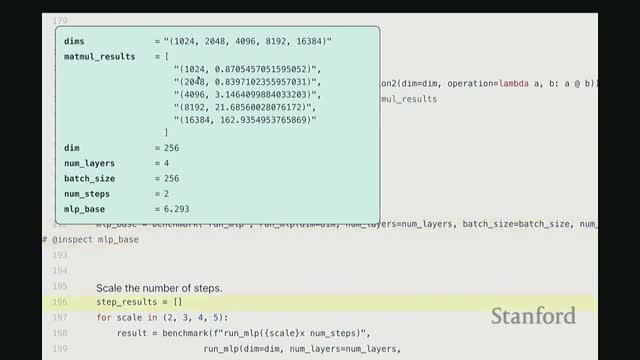
Matrix multiply timings grow predictably with matrix size, but at small sizes runtimes are dominated by fixed overheads (kernel launch, CPU–GPU transfer, small-matrix code paths).
- Once matrices are large enough, runtimes follow expected compute scaling.
- For a stacked Linear + GLU MLP:
- End-to-end runtime scales approximately linearly with the number of forward/backward steps.
- Runtime also scales roughly linearly with the number of layers, indicating per-layer costs aggregate predictably.
- End-to-end runtime scales approximately linearly with the number of forward/backward steps.
- Benchmarking these scalings helps decide where to focus optimization (large GEMMs vs per-layer elementwise overhead).
Profilers expose low-level CUDA activity behind PyTorch calls, including kernel launches and synchronization
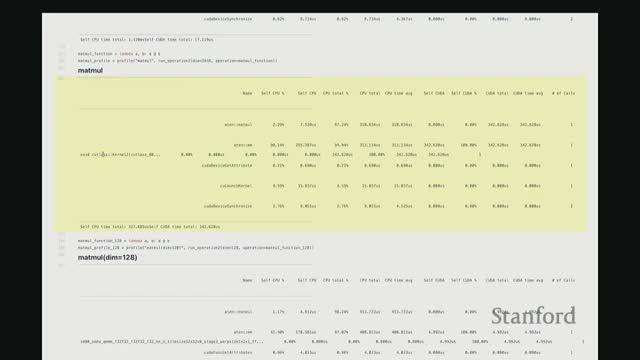
A profiler reveals how high-level PyTorch ops map down the stack:
- High-level ops dispatch to lower-level AOT/C++ wrappers and specific CUDA kernels (elementwise/vectorized kernels, GEMM primitives).
- CPU-side costs include cuLaunchKernel overhead and cudaDeviceSynchronize wait time.
Example cases identified by profiling:
- A no-op sleep shows primarily device synchronization costs.
- An elementwise add maps to a vectorized elementwise kernel plus an A10 C interface wrapper.
-
GEMM dispatches to cuBLAS/cuTensile kernels tuned for specific tile sizes and hardware.
Caveats:
- Profilers add overhead and can perturb microsecond-scale timings, but they reliably identify dominant GPU kernels and CPU-side dispatch/launch costs.
Composite primitives like cdist decompose into GEMMs, elementwise ops, and copies with GEMM typically dominating
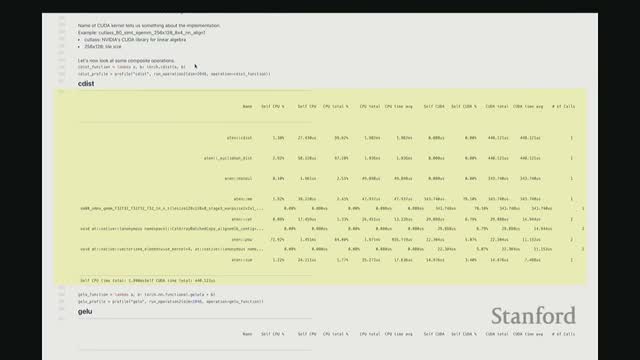
Computing pairwise Euclidean distances (cdist) decomposes into linear-algebra primitives:
-
GEMM operations for dot-products.
- Elementwise power operations and sums.
- Copies/concatenations for assembling outputs.
Profiling a composite cdist shows:
-
GEMMs often consume the majority of GPU time (e.g., ~70–80%).
- Copies and elementwise kernels consume smaller percentages.
Implication:
- Accelerating or selecting the best GEMM implementation yields the largest payoff for cdist-style computations.
Fused implementations exist for key nonlinearities such as GELU and softmax to minimize memory traffic and launch overhead
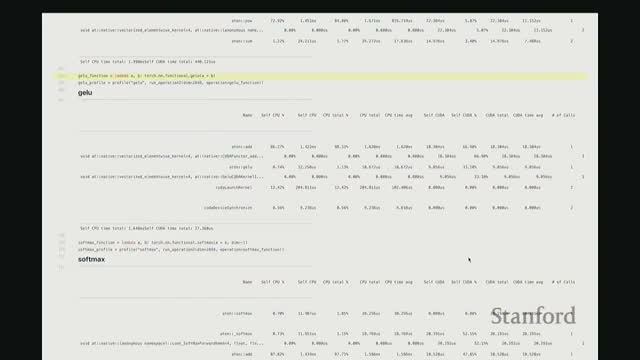
- Nonlinearities used in language models—GELU and softmax—are typically implemented as fused CUDA kernels that combine multiple arithmetic steps into one device pass.
-
GELU is a composition of operations (often approximated via polynomial or tanh-based forms) and benefits from evaluating the full expression in registers to avoid intermediate global-memory writes.
-
Softmax requires reductions and numerically stable exponentiation: fused kernels subtract the row-wise max, exponentiate, reduce sums, and divide in a single pass.
- Using fused operators reduces DRAM traffic and kernel-launch overhead, significantly improving throughput versus composing separate primitive kernels.
CPU and GPU execute asynchronously; NVTX annotations and Nsight timelines reveal queueing, synchronization points, and the effect of CPU-side operations
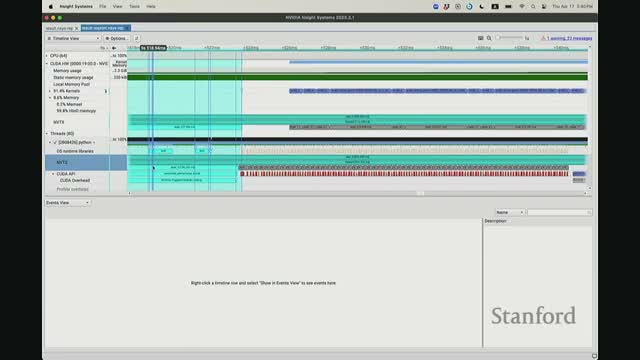
- The CPU dispatches CUDA kernels asynchronously and can enqueue many kernels ahead of GPU execution up to a hardware/driver queue depth.
-
Nsight and NVTX annotations make that queueing visible by mapping CPU code ranges to GPU events in hardware timelines.
- If the CPU issues a host-side operation that requires a GPU result (e.g., printing a loss), the code must synchronize, forcing the CPU to wait and changing pipeline/queue behavior.
- Annotating code with NVTX and inspecting CUDA hardware timelines in NVIDIA Nsight helps understand initialization overheads, command queue depth, kernel ordering, and where CPU-side synchronization causes stalls or reduces concurrency.
Kernel fusion concept: fuse multiple elementwise ops into one kernel to reduce repeated memory movements
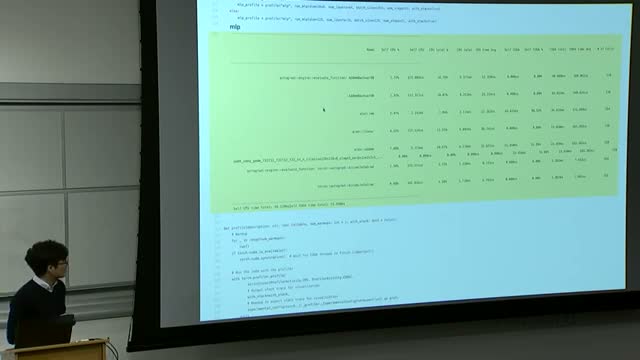
Kernel fusion consolidates sequential elementwise operations into a single GPU kernel so intermediate results remain in registers or shared memory rather than being written to and re-read from global DRAM.
Benefits of fusion:
- Fewer kernel launches.
- Reduced global memory bandwidth usage.
- Increased arithmetic intensity.
- Often yields order-of-magnitude improvements on elementwise-heavy code paths.
Fusion is a critical optimization for non-GEMM portions of language models where memory traffic otherwise dominates.
A naive PyTorch elementwise GELU implementation issues many kernels and is much slower than a fused implementation
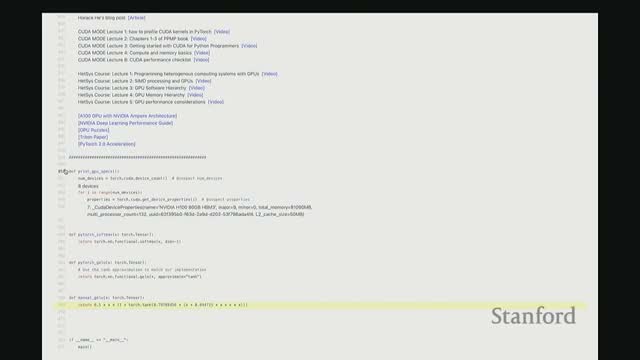
- Writing GELU as a sequence of PyTorch operations (constants, multiply, tanh, power, additions) produces multiple separate kernels.
- Each kernel performs a full pass over the tensor, causing repeated DRAM reads/writes plus launch overhead.
- Benchmarking shows the naive multi-kernel PyTorch sequence is significantly slower (several-fold) than a single fused kernel that evaluates the same algebra in one pass.
Conclusion: this motivates implementing fused kernels in CUDA, Triton, or relying on JIT-based fusion to reclaim performance.
How a custom CUDA kernel implements fused elementwise computation using the grid/block/thread model
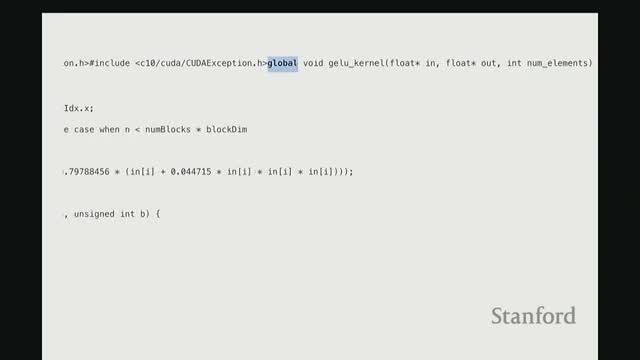
A CUDA kernel typically comprises three components:
- A host-side wrapper that prepares inputs/outputs and computes launch parameters.
- A __global__ kernel function that executes on the device.
- A launch configuration specifying grid and block dimensions.
Kernel coding pattern:
- Compute a global index: I = blockIdx.x * blockDim.x + threadIdx.x and check bounds (I < num_elements).
- Perform pointer-based loads into registers, compute the fused expression in registers, and store results back to global memory.
- Efficient practices: allocate outputs with torch.empty_like to avoid unnecessary initialization, choose block sizes to saturate SMs, and use synchronous launches during debugging.
Example impact: a fused CUDA GELU kernel reduced measured runtime from ~8 ms (naive) to ~1.8 ms in the example.
Triton DSL: block-centric vectorized GPU programming in Python that emits PTX

-
Triton is a Python-based domain-specific language that expresses GPU kernels at the thread-block level while abstracting thread management, memory coalescing, and shared-memory use.
- Authors program in terms of blocks and vectorized offsets: each block computes a contiguous vector of offsets, performs masked/coalesced loads, computes on those vectors (keeping temporaries in registers), and stores results back.
- The Triton compiler generates efficient PTX (showing grouped LDs that load multiple lanes and fused floating-point sequences), enabling rapid development of fused kernels.
- In many cases, Triton delivers performance comparable to hand-written CUDA while dramatically reducing development effort.
Torch.compile JIT can automatically fuse operations and emit Triton kernels to approach or exceed hand-written kernels for many primitives
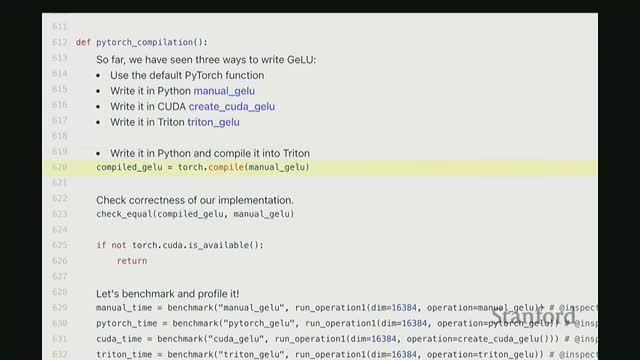
- Modern JIT compilers (e.g., torch.compile) perform end-to-end transformations that include operation fusion and microbenchmark-driven selection of optimal GEMM subroutines for the target device.
-
torch.compile can generate Triton kernels under the hood to fuse elementwise sequences and pick high-performance implementations for matrix multiplications.
- For many workloads, JIT-generated code achieves performance close to or better than manually written Triton/CUDA.
- Caveat: highly specialized routines (e.g., recent FlashAttention variants exploiting specific hardware features) may still benefit from hand-tuned kernels.
Recommended workflow: rely on JIT/fusion for most cases and reserve custom kernels for uniquely constrained hotspots identified by profiling.
Softmax in Triton: handle reductions by assigning rows to blocks, using vectorized loads, computing max/exponentials/sum, and writing normalized outputs
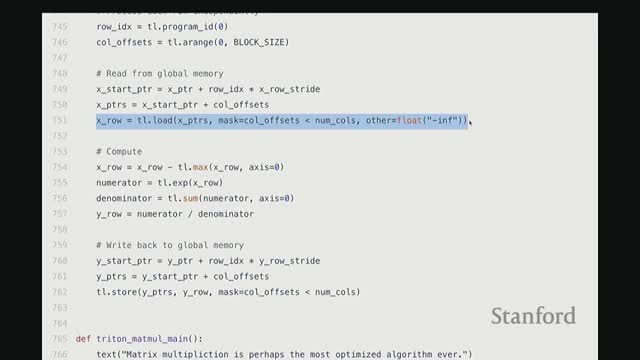
Row-wise softmax requires a reduction across the row; a common Triton design maps one block per row so the block can load columns into lanes and compute a numerically stable softmax in-block:
- Subtract the row max (numerical stability).
- Exponentiate the shifted values.
- Reduce to a sum.
- Divide to normalize.
Triton implementation details:
- Use next_power_of_two to pick convenient block sizes.
- Use masked loads to handle tail elements.
- Use vectorized LD/STs to exploit memory coalescing.
Benchmarking observations:
- Naive multi-pass implementations are slow due to repeated DRAM access and multiple kernels.
- Fused compiled / PyTorch / Triton softmax kernels substantially reduce kernel-launch and memory costs, yielding much faster per-row softmax performance.
Enjoy Reading This Article?
Here are some more articles you might like to read next: